# How FuzzyCat Works
FuzzyCat is an unsupervised general-purpose soft-clustering algorithm that, given a series of clusterings on object-based data, produces data-driven fuzzy clusters whose membership functions encapsulate the effects of changes in the clusters due to some underlying process. FuzzyCat propagates these effects into a soft-clustering which has had these effects abstracted away into the membership functions of the original object-based data set.
The goal of this page is to provide an intuitive overview of how the FuzzyCat algorithm works. To aid the explanation, we will first look at a simple clustering problem that has no obvious solution -- which we will later see that FuzzyCat can help provide.
## A seemingly simple clustering problem
Imagine that we wanted to find the clusters from this 2-dimensional toy data set.
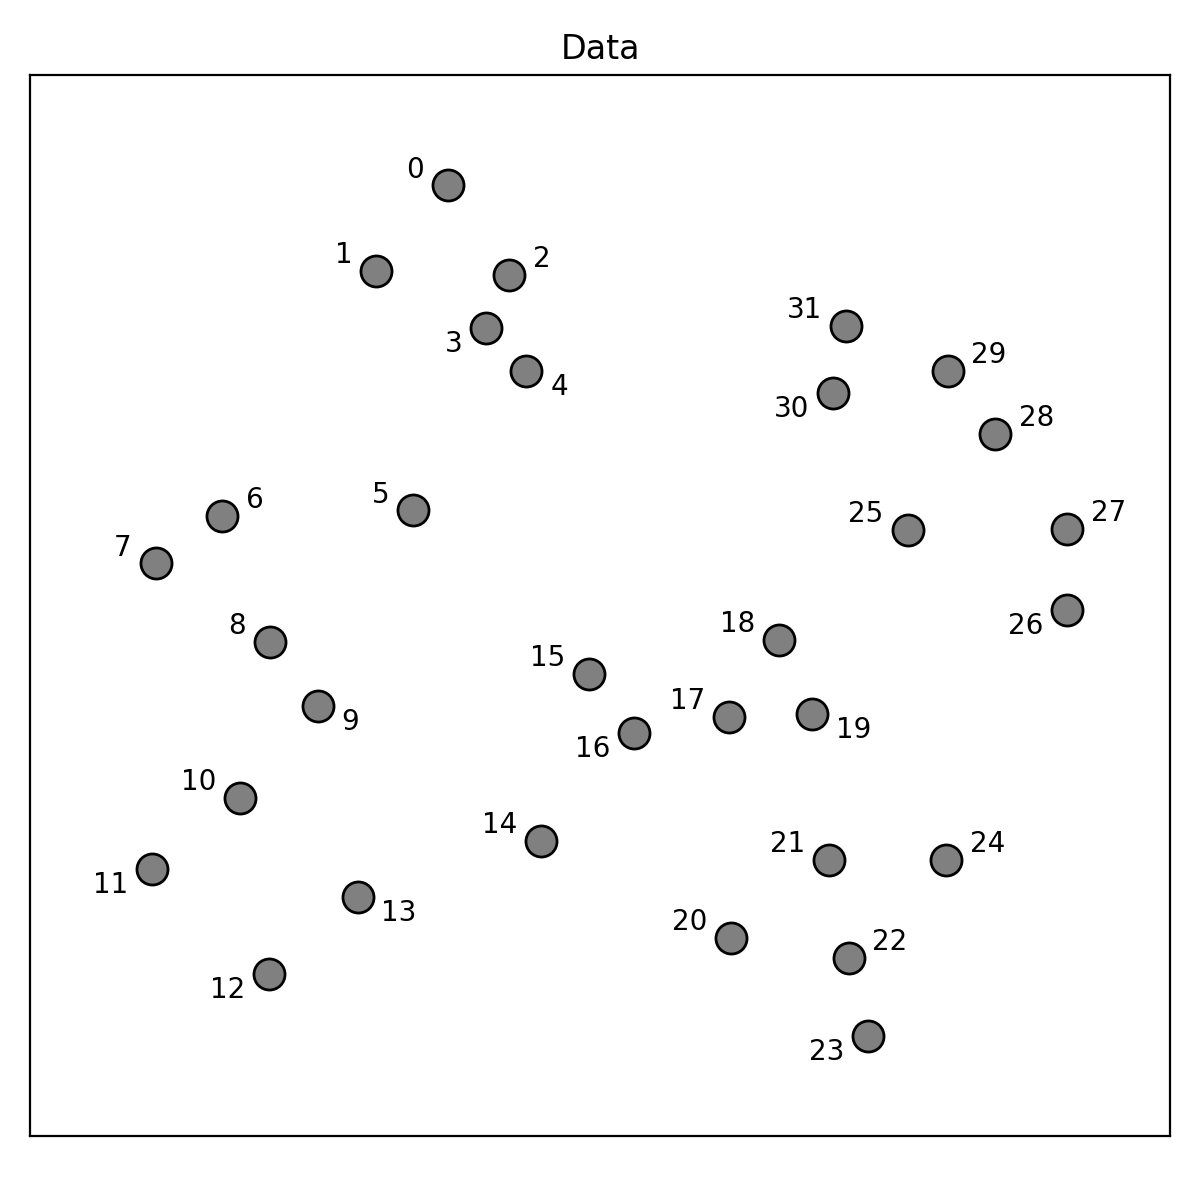
The data is very simple and so we decide to use a simple algorithm, k-means. [K-means](https://en.wikipedia.org/wiki/K-means_clustering) is an iterative clustering algorithm that partitions a data set into _k_ distinct clusters by minimizing the sum of squared distances between data points and their respective cluster centroids. However the structure within this data set is somewhat ambiguous in nature, and so we immediately run into the problem of choosing an appropriate value for _k_. Expecting that an appropriate value exists somewhere in the range of [1, 10], we start by applying k-means with each of these _k_ values to the data. The clusterings appear as follows...
While this might give us some intuition about some _k_ values being better than others, we are still not convinced by the visualisation of the results that any one of _k_ values is better than all the others. The literature suggests that we should look to the plots of the sum of squared errors and the silhouette coefficient as functions of _k_...
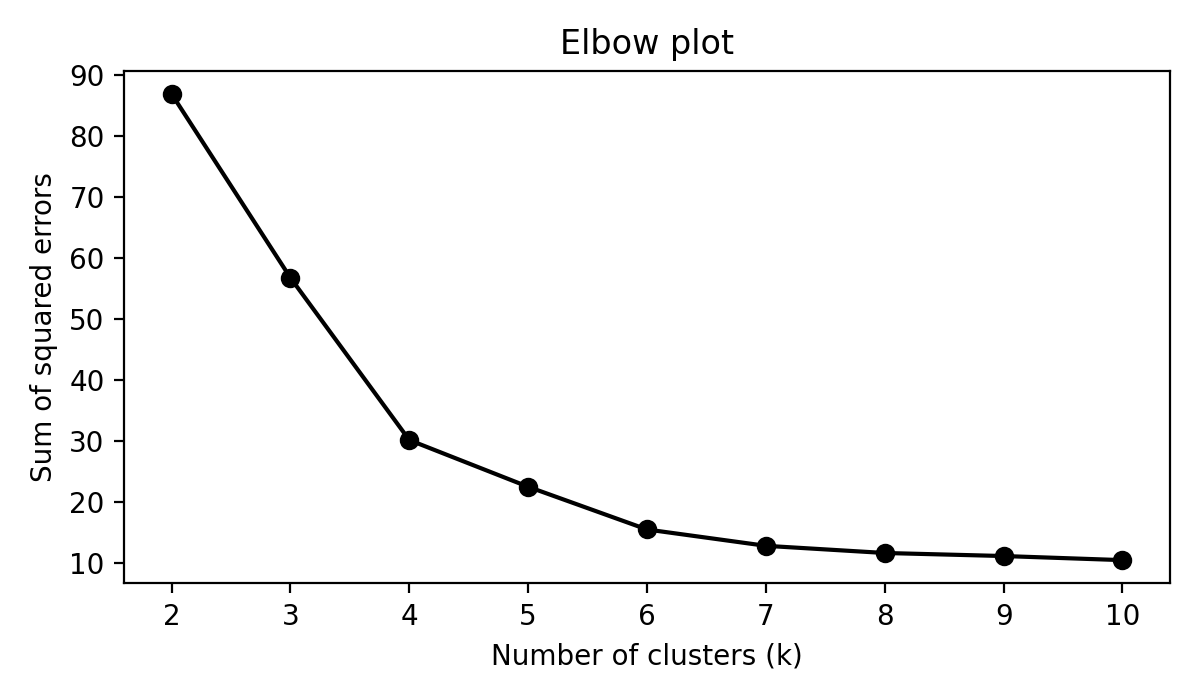
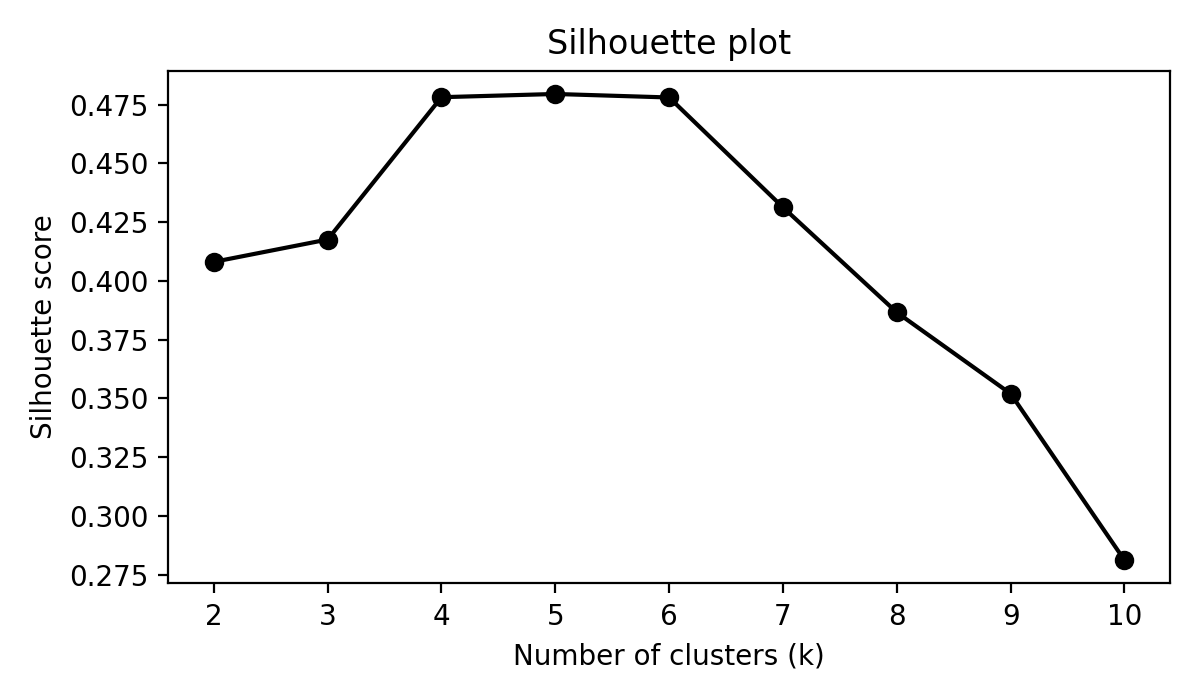
Typically, one chooses a value of _k_ by looking for an _elbow_ in the first plot and a peak in the second. We see that _k_ values around 4 to 6 roughly satisfy these descriptions, however it is not obvious for exactly which _k_ value this occurs. It seems that we are just limited by having to make a choice for _k_ and that what we would actually like to do is combine the results we get when using multiple _k_ values.
If it is indeed the latter, then we would like to abstract the effect of a changing _k_ value into a representation of k-means-like clusters that remain stable over a range of _k_ values -- this is a task for FuzzyCat!
## The FuzzyCat algorithm
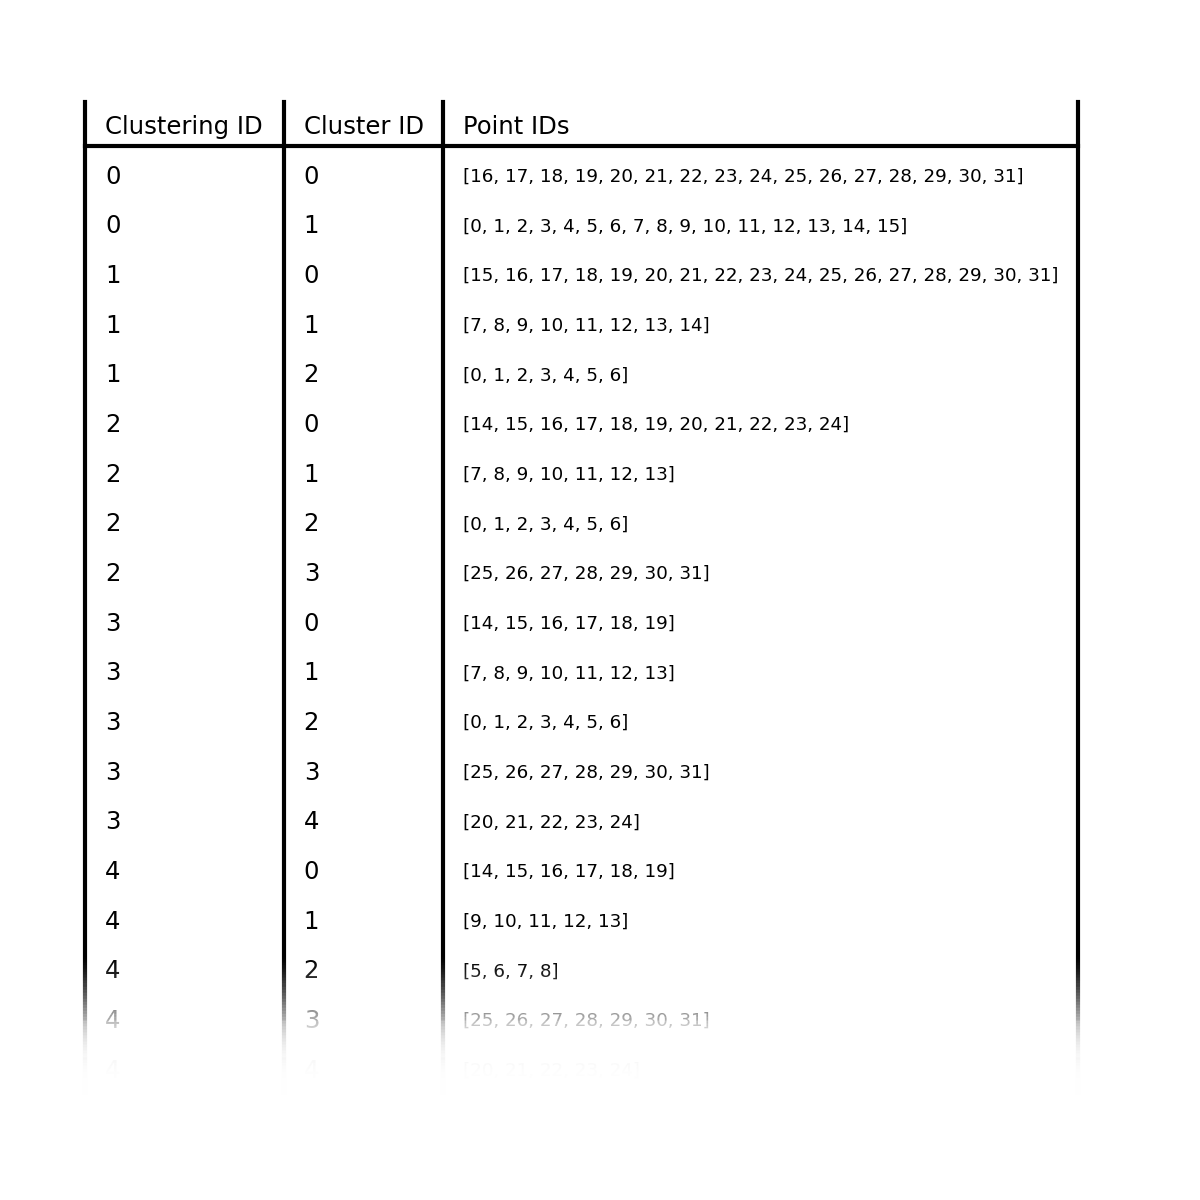
In order to run the FuzzyCat algorithm on these clustering results, we first need to translate them into the necessary format, i.e. we need a record of which points belonged to which clusters in which clustering instances. This information can be summarised for the above clustering problem as follows:
### A similarity matrix for clusters
With this table of clustering information, FuzzyCat first computes a matrix of Jaccard indices calculated for every pair of clusters. For two clusters, the Jaccard index is their intersection divided by their union -- which for the first two clusters in the table above is 0 (as they do not intersect), but for the first and third clusters it is :math:`16/17 \approx 0.94`. As such, the Jaccard index matrix for our problem looks like...
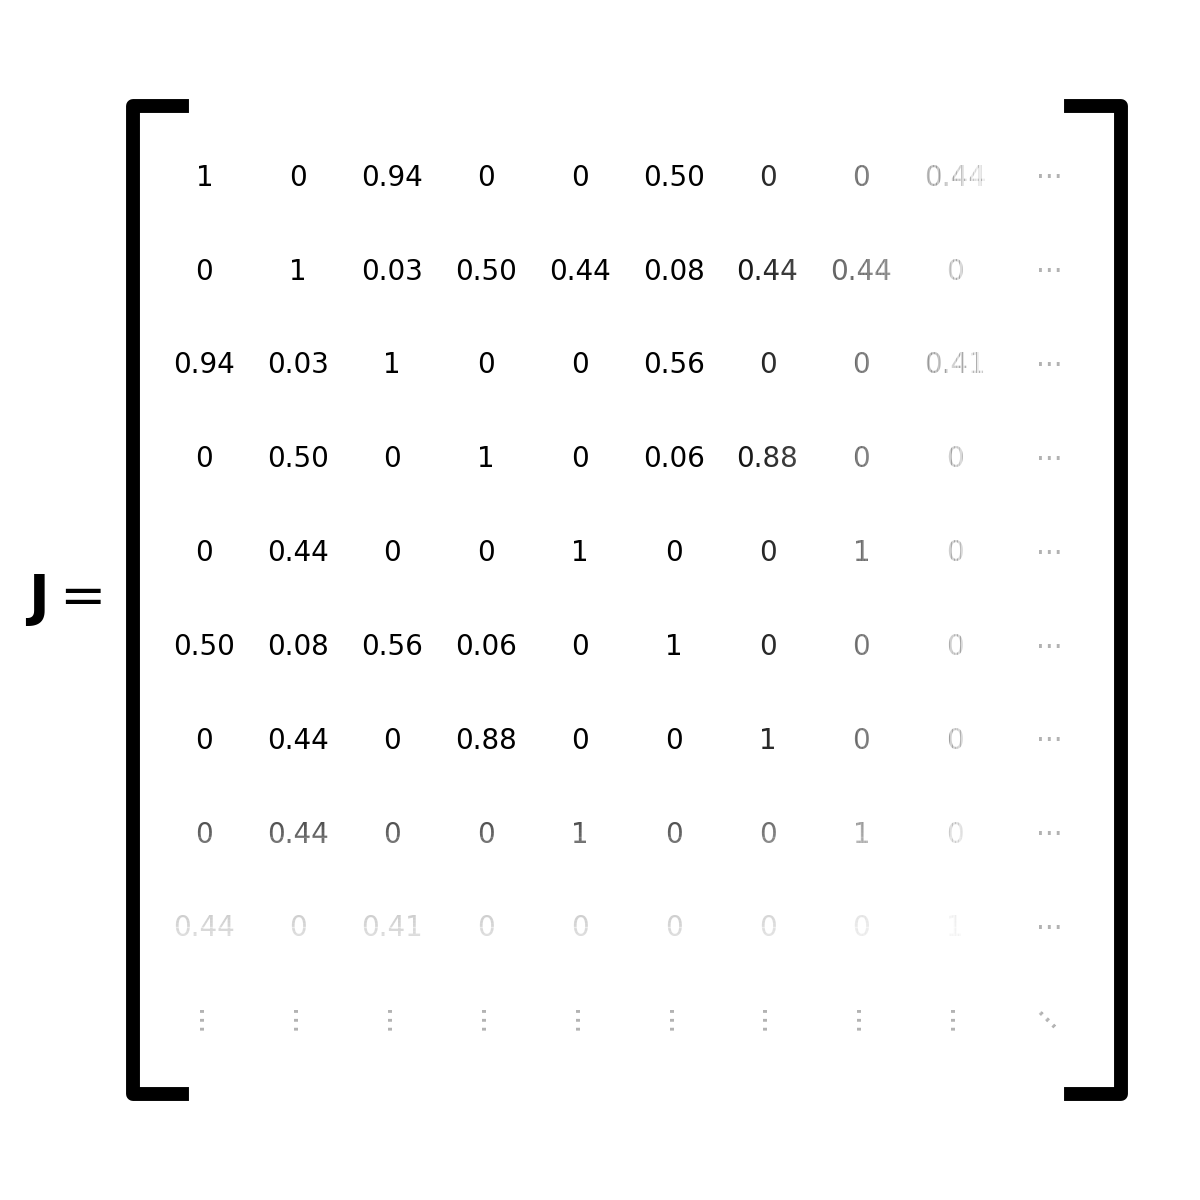
This matrix is symmetric and the elements of the main diagonal are trivially equal to 1, so in reality FuzzyCat only actually computes the upper right (or equivalently, lower left) :math:`n(n - 1)/2` elements of this matrix.
### Finding a representation of the fuzzy clustering structure
Each of these Jaccard indices are now treated as edge weights that connect each of the input clusters, and with these edges, FuzzyCat then finds all possible _overdensities_ from the Jaccard space of all clusters and clusterings. Unfortunately we can't easily visualise this process as it evolves within FuzzyCat because clusters inhabit a very high dimensional space. Luckily however, the steps taken in this process are nearly identical to the AstroLink aggregation process (described in section 3.4 of the original [science paper](https://doi.org/10.1093/mnras/stae1029) and within its [documentation](https://astrolink.readthedocs.io/en/latest/howitworks.html#compute-an-ordered-list-and-a-binary-tree-of-groups)), and since it is much simpler to visualise a 2-dimensional toy data set that a very high dimensional space of all possible clusters, we can refer to a visualisation of the way this process works within AstroLink to gain insight into how it works within FuzzyCat.
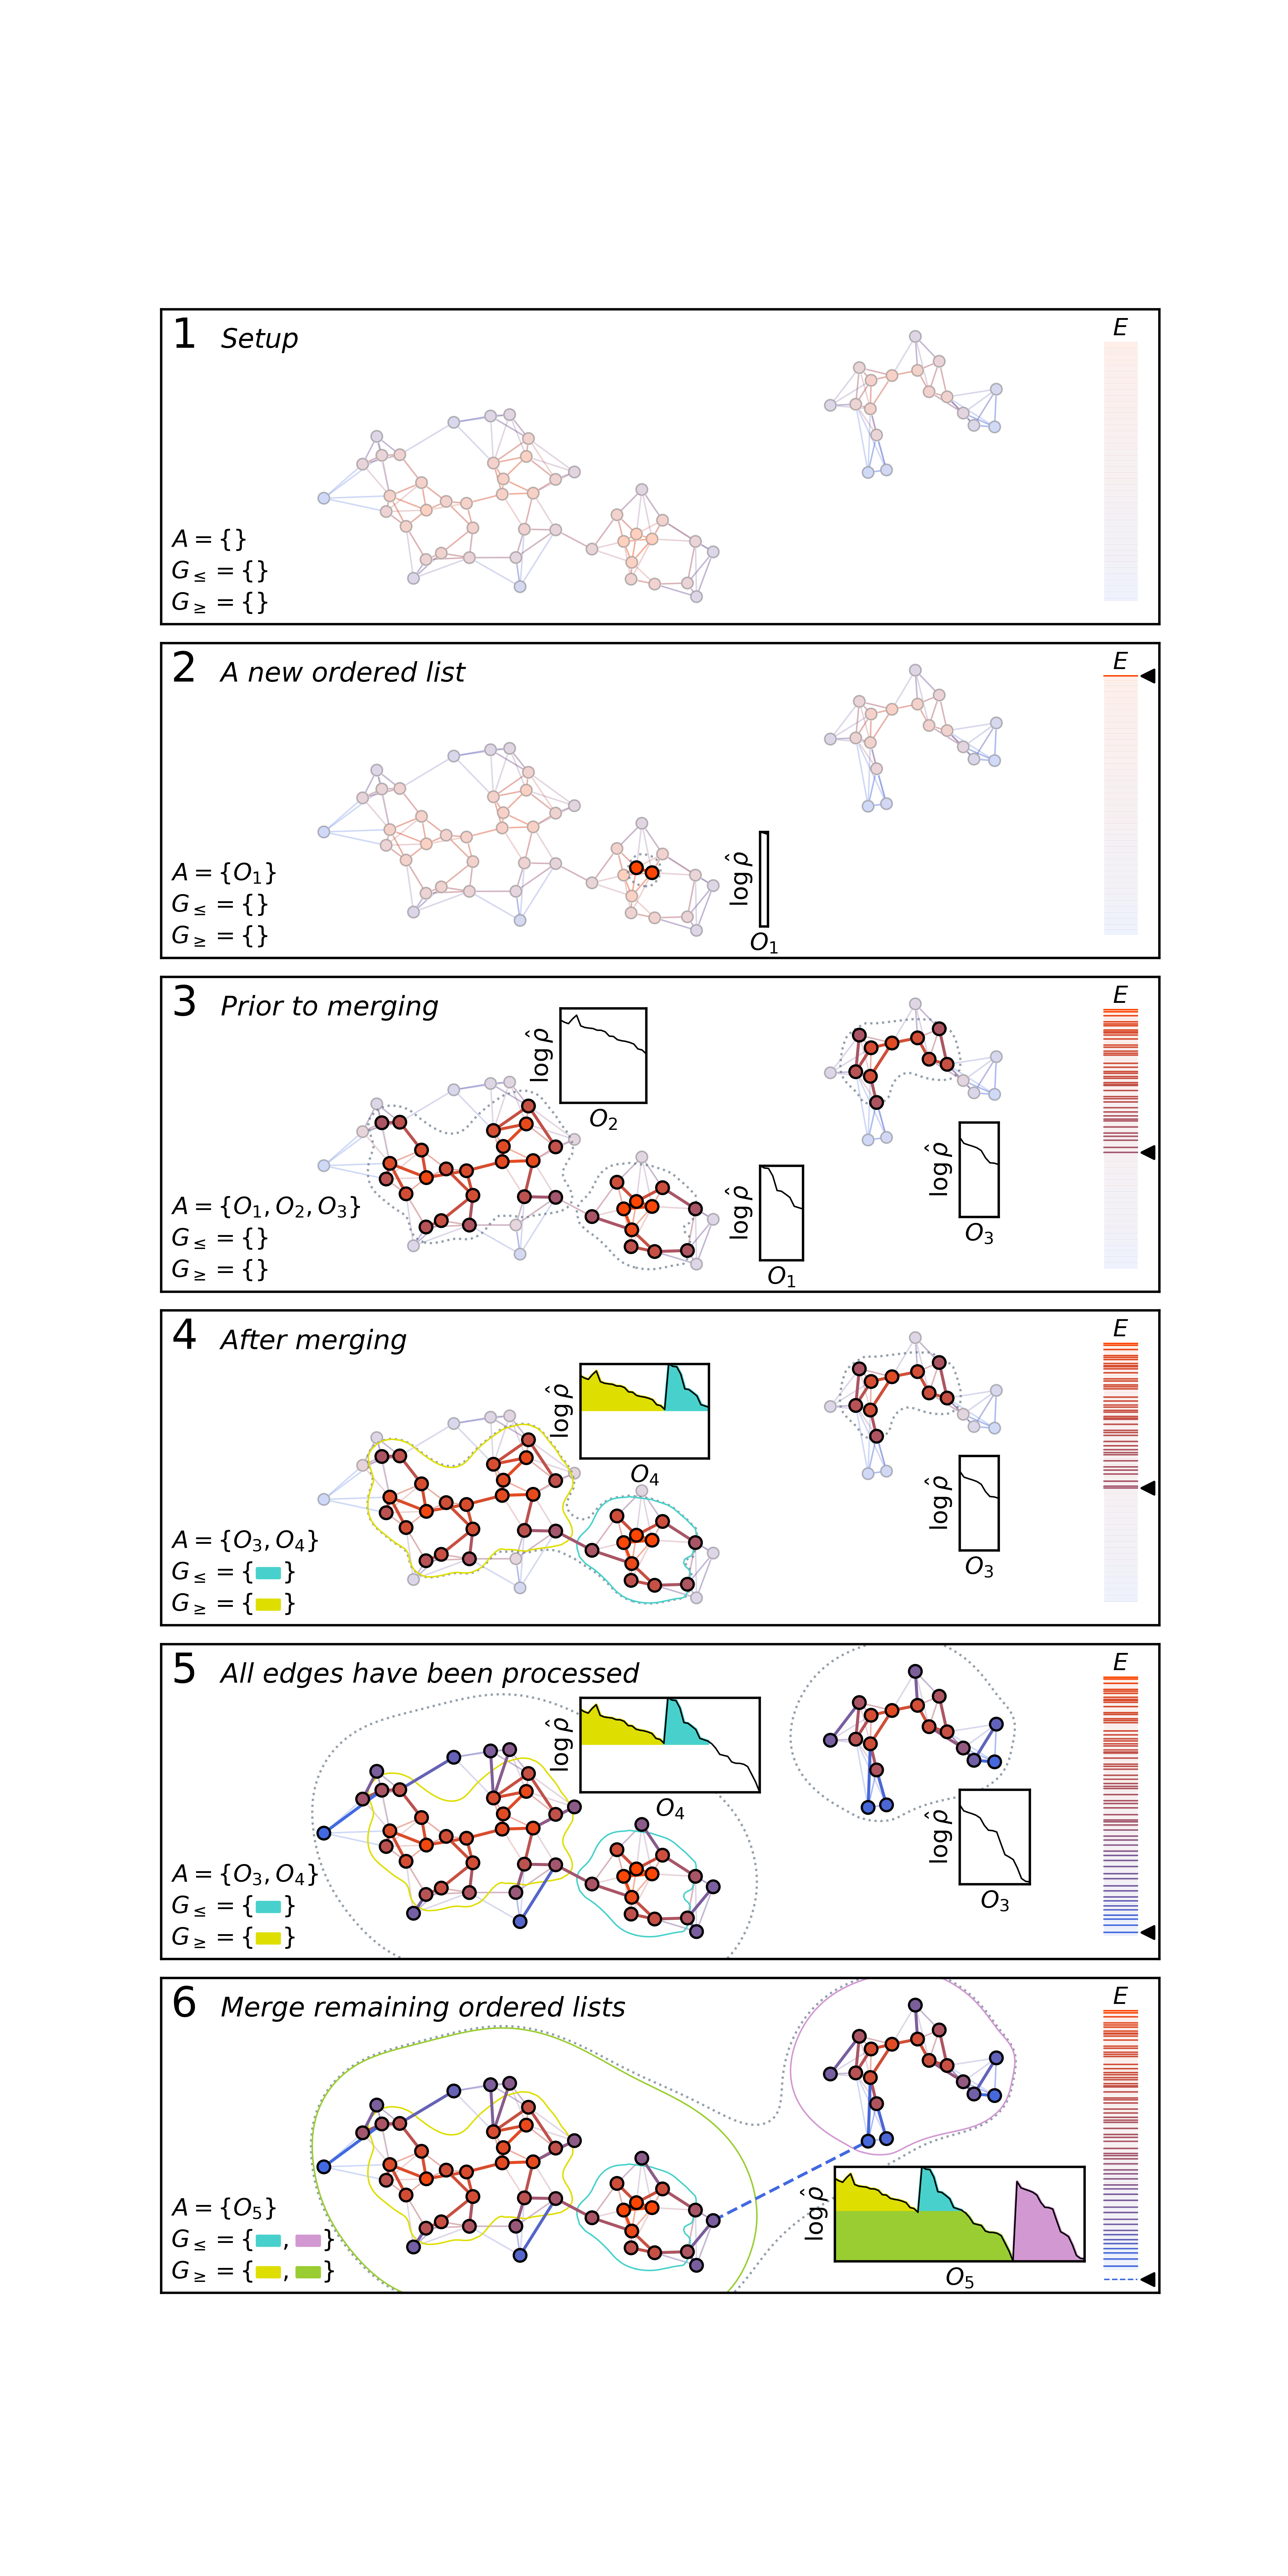
This visualisation for the AstroLink aggregation process can be thought of as a kind of reduced-dimensionality version of what happens inside FuzzyCat. Without loss of generality for either algorithm...
- A list of edges (denoted E above) between each object of the input data set are processed in descending order of edge weight. In AstroLink, the weights of these edges are related to the local-density of the input data, while in FuzzyCat, these edges are the aforementioned Jaccard index values that are calculated for each pair of clusters.
- As the edges are processed, ordered lists of the data objects are built to develop a representation of the structure of the input data. A new ordered list of objects is formed whenever neither of the two objects connected by an edge are found to belong to an existing ordered list.
- These ordered lists grow as more objects are connected to them, edge by edge. When eventually an edge is processed that would merge two separate ordered lists, the two ordered lists represent potentially-informative overdensities, so both AstroLink and FuzzyCat store them for later consideration. After they are stored, the two ordered lists are merged into one, and the process continues until all edges have been processed and one ordered list remains.
Besides the meaning of _data objects_, there are two differences between FuzzyCat and AstroLink with regards to this process...
1. FuzzyCat doesn't perform any equivalent of step 6, since the edges from the Jaccard index matrix denote a densely-connected graph; and
2. Unlike Astrolink, FuzzyCat doesn't keep track of two separate sets of connected components, :math:`G_\geq` and :math:`G_\leq`, instead all connected components are stored in one list, G. This is because FuzzyCat doesn't need to differentiate between the larger and smaller of any two connected components within the extraction procedure that follows this process.
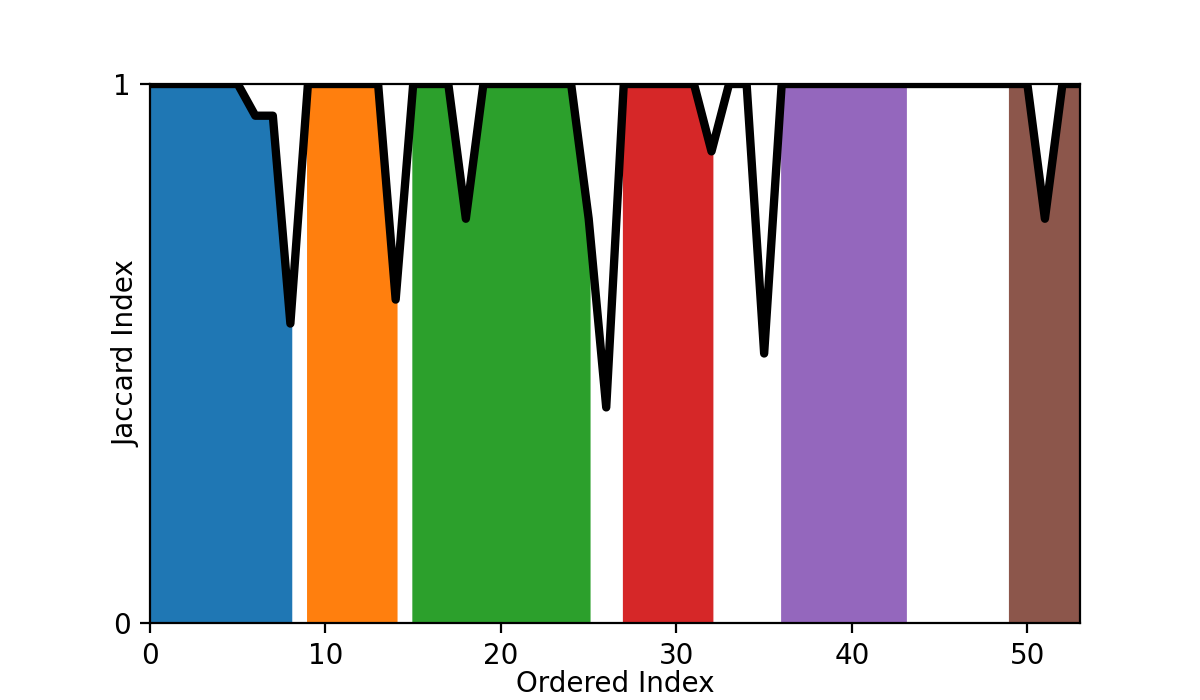
The resulting information gained from the aggregation process above is a representation of all overdensities within the data, which for FuzzyCat is the ordered-Jaccard plot and the list of all possible fuzzy clusters. Returning to our k-means clustering problem, this plot would appear as follows.
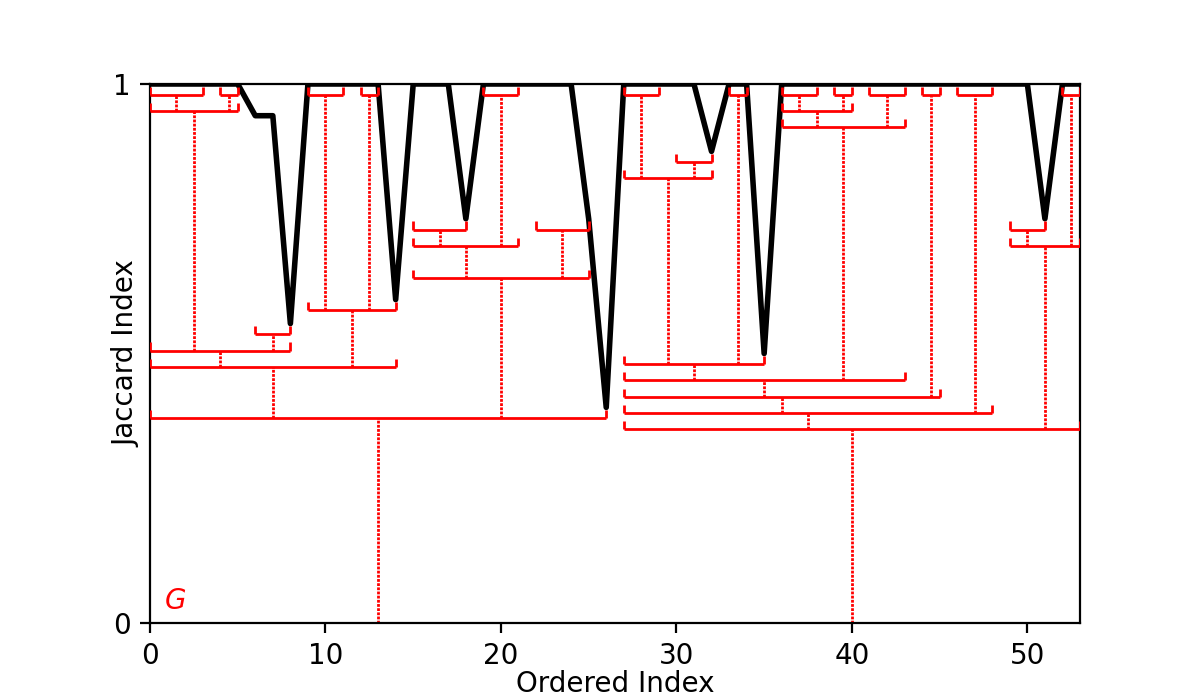
The ordered-Jaccard plot is notably less interpretable than the ordered-density plot found by AstroLink, but we see that that some structure amongst the chaos has been revealed.
### Extracting meaningful fuzzy clusters
With a list of all possible fuzzy clusters, FuzzyCat now extracts only those fuzzy clusters that satisfies certain constraints. We want the final fuzzy clusters to represent stable clusters of the underlying data set. Given that we already a list of Jaccard space overdensities, the final fuzzy clusters should be those that are sufficiently self-similar, distinct from each other, and stable over the various clustering realisations.
FuzzyCat governs this behaviour with three hyperparameters, `minIntraJaccardIndex`, `maxInterJaccardIndex`, and `minStability` respectively. To reiterate, these hyperparameters can be described as follows:
* `minIntraJaccardIndex` : `float`, default = 0.5
- The minimum Jaccard index that at least two clusters within a fuzzy cluster must have for it be included in the final set of fuzzy clusters.
* `maxInterJaccardIndex` : `float`, default = 0.5
- The maximum Jaccard index that any two fuzzy clusters can have for them to be able to included in the final set of fuzzy clusters.
* `minStability` : `float`, default = 0.5
- The minimum stability that a fuzzy cluster must have to be included in the final set of fuzzy clusters.
The default values work well in most cases, particularly with regards to the Jaccard index based parameters since a value of 0.5 marks a transition point where two clusters become more (dis-)similar to one another than not. The `minStability` may be adjusted more readily, particularly in the case of applying FuzzyCat to temporally evolving data -- where it should be calculated so as to yield fuzzy clusters that remain stable over a minimum length of time.
For our running k-means example, extracting fuzzy clusters using the default leaves fuzzy clusters as marked on the ordered-Jaccard plot below.
For each of these fuzzy clusters a series of properties are then also calculated. Among them are;
* `stabilities` : `numpy.ndarray` of shape (n_fuzzyclusters,)
- The stability of each fuzzy cluster.
* `memberships` : `numpy.ndarray` of shape (n_fuzzyclusters, nPoints)
- The membership probabilities of each point to each fuzzy cluster.
* `memberships_flat` : `numpy.ndarray` of shape (n_fuzzyclusters, nPoints)
- The flattened membership probabilities of each point to each fuzzy cluster, excluding the hierarchy correction. If the fuzzy clusters are inherently hierarchical, then `memberships_flat` may be more easily interpretable than `memberships` since `memberships_flat.sum(axis = 0)` will be contained within the interval [0, 1].
* `fuzzyHierarchy` : `numpy.ndarray` of shape (n_fuzzyclusters, n_fuzzyclusters)
- Information about the fuzzy hierarchy of the fuzzy clusters. The value of `fuzzyHierarchy[i, j]` is the probability that fuzzy cluster `j` is a child of fuzzy cluster `i`.
### What do the fuzzy clusters look like?
Returning to the underlying data, the fuzzy clusters found by FuzzyCat can be visualised as follows:
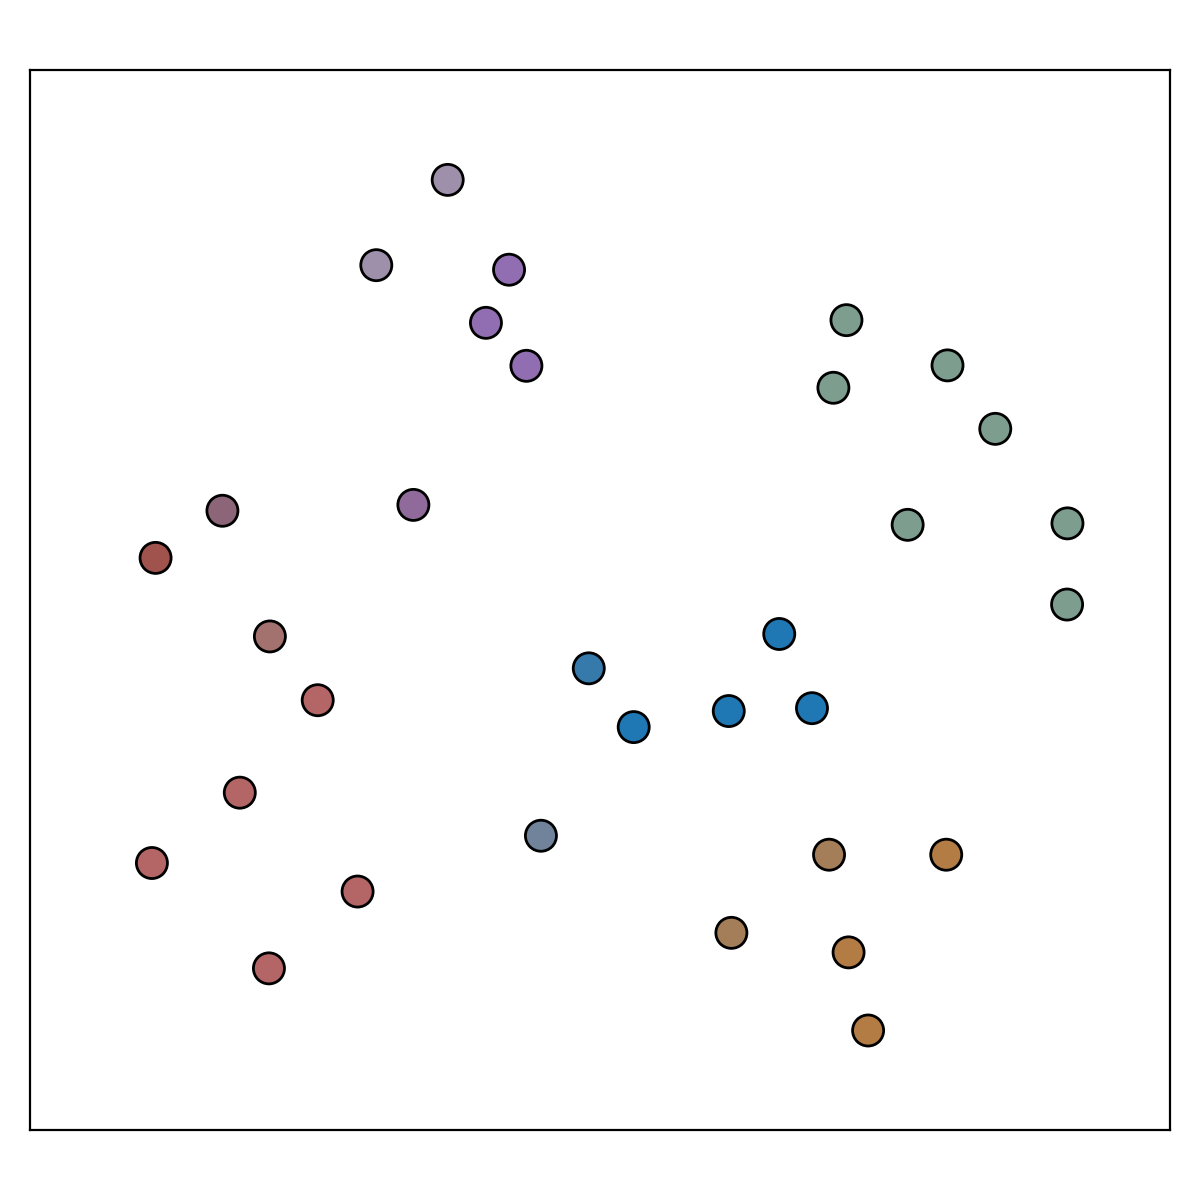
Here, the colour of each point is defined as a weighted sum of the colours that correspond to one of the six fuzzy clusters (as shown previously in the ordered-Jaccard plot). The weight of each colour is the stability of the fuzzy cluster multiplied by the membership of the point to that that fuzzy cluster. As such, the above figure can be interpreted as a visualisation of the probability that each point belongs to one of the fuzzy clusters.
Even still, and for improved interpretability, we can be more specific and deliberate in our visualisations. Like this for example;
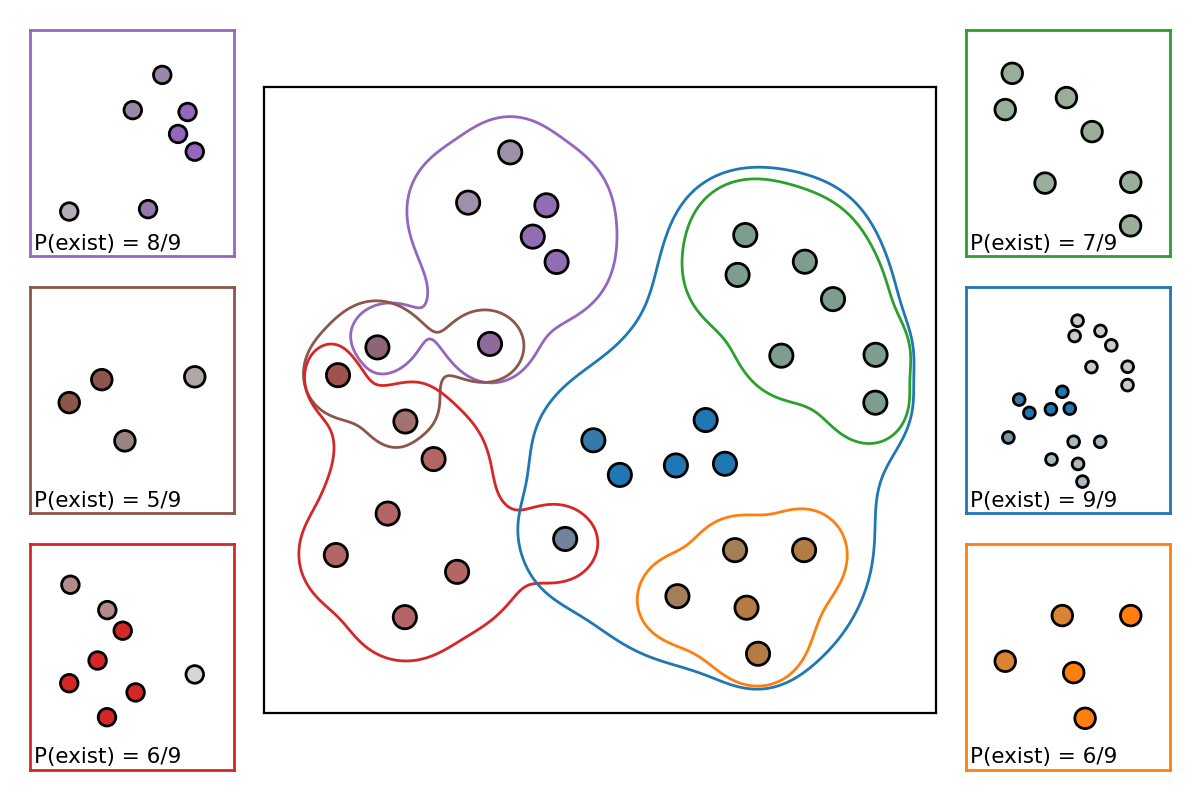
Now we are visualising an _exploded_ diagram of the fuzzy clusters. The central panel is the same as the previous figure, only now with extra contours outlining the fuzzy clusters. Each of the surrounding axes corresponds to one fuzzy cluster, and each point within these axes is coloured according to it's membership to that fuzzy cluster alone (the stability of the fuzzy cluster is marked on the axis although this doesn't influence the colour here). This view really allows us to see how (in this case) FuzzyCat has found stable k-means-_like_ soft clusters that don't depend upon any single value of _k_. In fact the final fuzzy clusters are an amalgamation of several k-means clusters that are found from repeated application with various _k_ values. Furthermore, we can see that FuzzyCat has been able to find precisely 6 fuzzy clusters whose stabilities sum to :math:`\approx 4.5` (a kind of empirical expectation value for the number of _true_ k-means clusters). This range straddles the inital guess range, found from the Elbow and Silhouette plots, that seems to contain the best values of _k_.
Of course, we can always reduce the fuzzy clusters to the most-probable clustering. This is done by using the measure defined by the product of stability and membership to assign each point to the fuzzy cluster that it most-probably a member of. The resultant hard clustering looks like the following for our case...
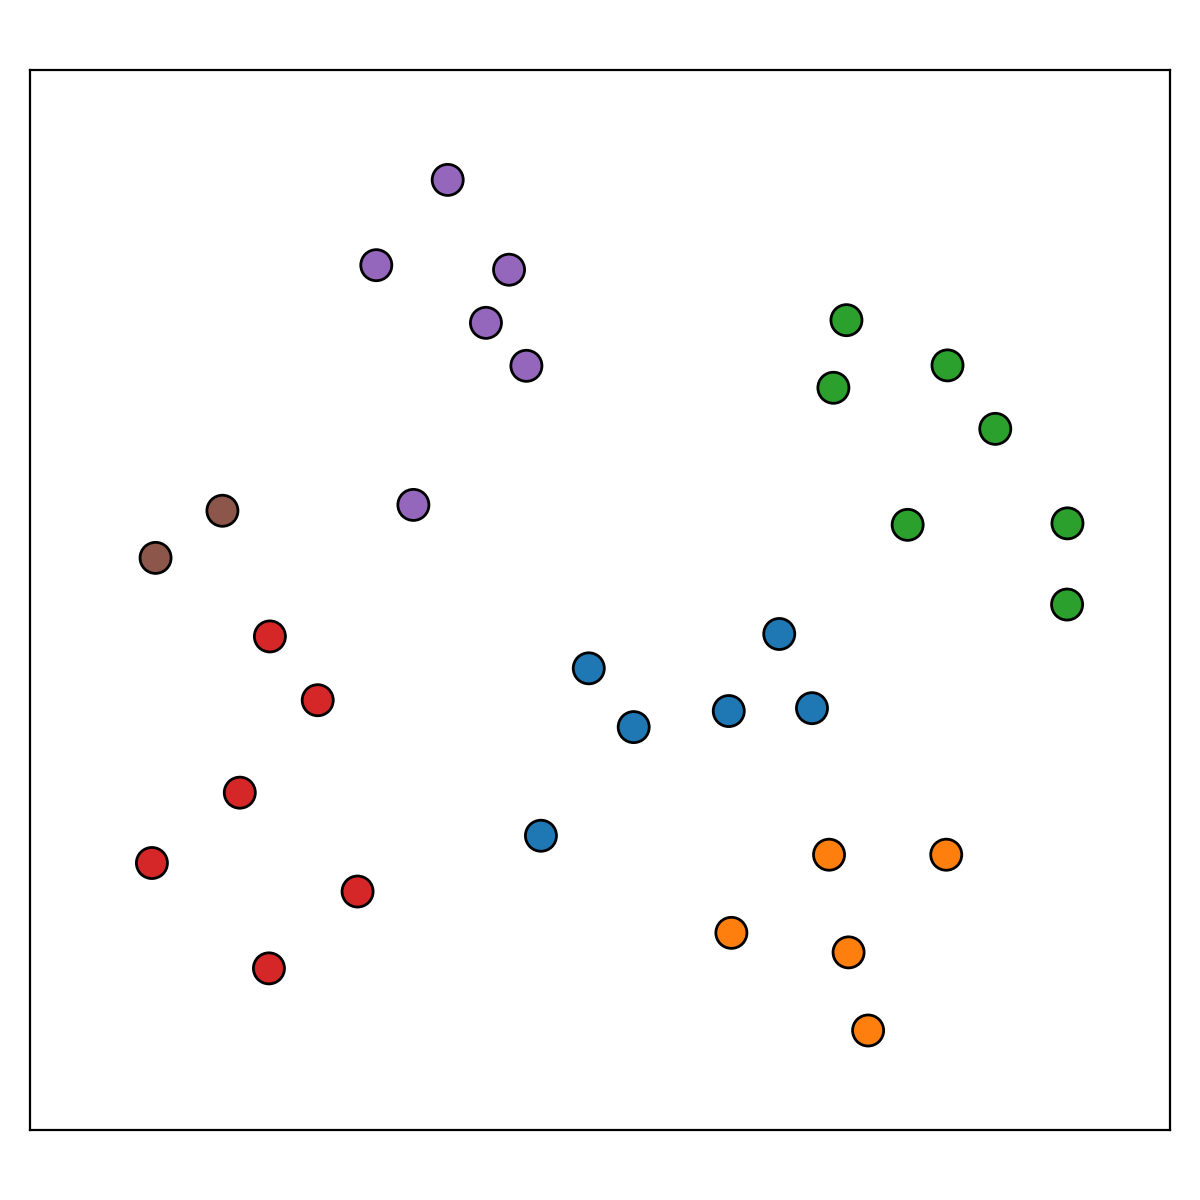
With this we reduce the results to a very interpretable version stable k-means-like clusters.
Of course this example is contrived in order to demonstrate _how_ FuzzyCat works, as such it is not a particularly motivating case for _why_ it should be used -- for this you should read through to the end of the next section :)